Frames
40
BRKMYR/Prototypes I built/Label Quality Engine
Auto-labeling economics for 3D perception. Two algorithmic labelers look at the same road through different sensors. Agreement is auto-accepted, disagreement goes to a human, and the engine prices the difference.
What it is
Two labelers look at the same road through different sensors: a camera detector projected into the LiDAR, and the LiDAR geometry alone. Where they agree, the label is auto-accepted. Where they disagree, or where only one of them found something, a human opens the frame. The engine measures what escapes, attributes every error to the sensor whose job it was, and prices the whole thing, so the auto-accept threshold becomes a decision with a number attached instead of a default.
No model was trained here. The 2D detector is off the shelf and the LiDAR backend is classical geometry. The contribution is the routing decision, the error attribution and the cost model.
Thesis
Routing on cross-sensor disagreement should dominate routing on model confidence on the cost-quality frontier, and the gap should widen with range. The verdict is one number: mean USD saved per frame at equal frame auto-accept rate, with a scene-clustered bootstrap confidence interval. If that number is zero or negative, or its interval includes zero, or the two frontiers do not overlap, the thesis failed and the failure is the headline.
The comparison, the evaluation region, the range bands, the escaped-error definition, the statistic and the failure condition were all written down before any real data was touched. The pre-registration carries the SHA-256 of the frozen run configuration.
Headline
Frames
40
Scenes
4
Auto-accept (frames)
0.600
Escaped error rate
0.454
C_total at tau*
115.24
tau*
0.79
Generated by lqe.fixtures.scene_gen. No third-party data. Proves the harness is correct. It proves nothing about the world.
Viewer
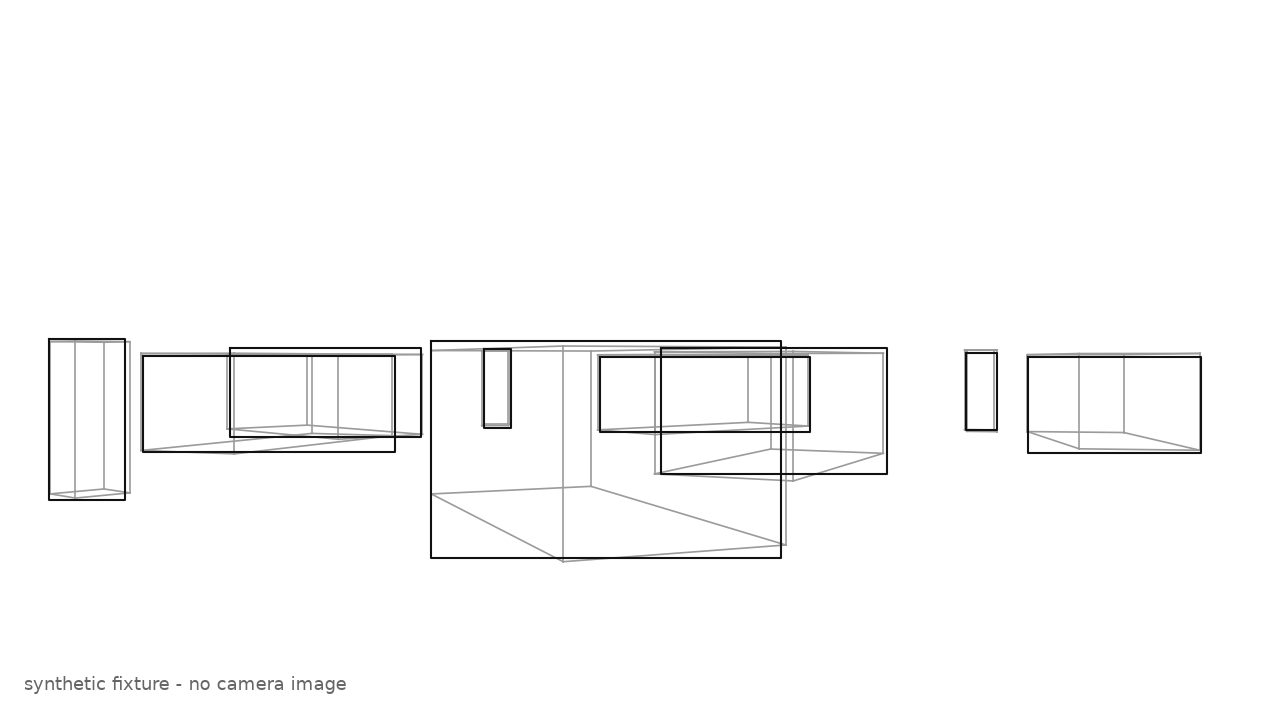
The 3D scene needs JavaScript and the report served over a local web server. Everything the report argues is in the figures below.
Per band
| Band | Frames | Consensus cuboids | References | Auto-accept (frames) | Auto-accept (cuboids) | Escaped error rate | Median offset (m) | Heading MAE (deg) | Class accuracy |
|---|---|---|---|---|---|---|---|---|---|
| all | 40 | 296 | 216 | 0.600 | 0.578 | 0.454 | 0.846 | 0.54 | 0.956 |
| near | 16 | 133 | 81 | 0.562 | 0.556 | 0.185 | 0.606 | 0.15 | 0.971 |
| mid | 15 | 91 | 63 | 0.533 | 0.582 | 0.460 | 1.023 | 1.08 | 0.929 |
| far | 13 | 72 | 72 | 0.692 | 0.611 | 0.750 | 1.246 | 0.74 | 0.958 |
Escaped error is errors per in-region reference object in accepted frames, and it counts the objects no backend predicted at all.
Frontiers
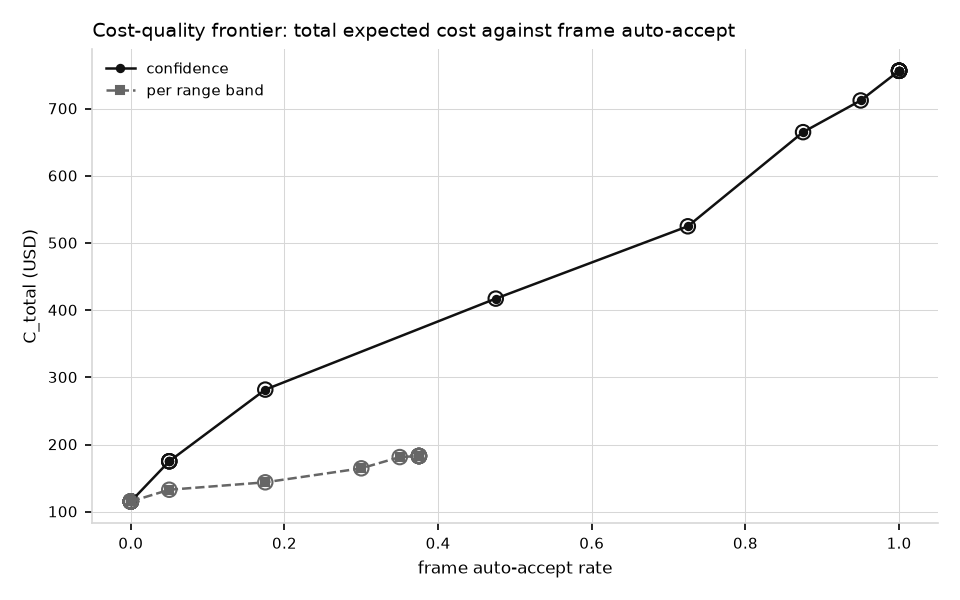
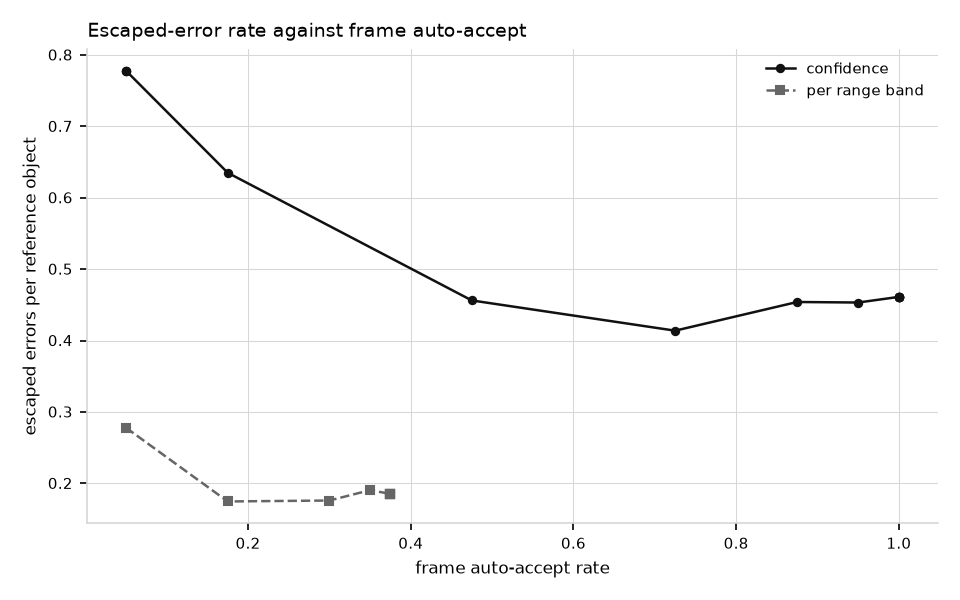
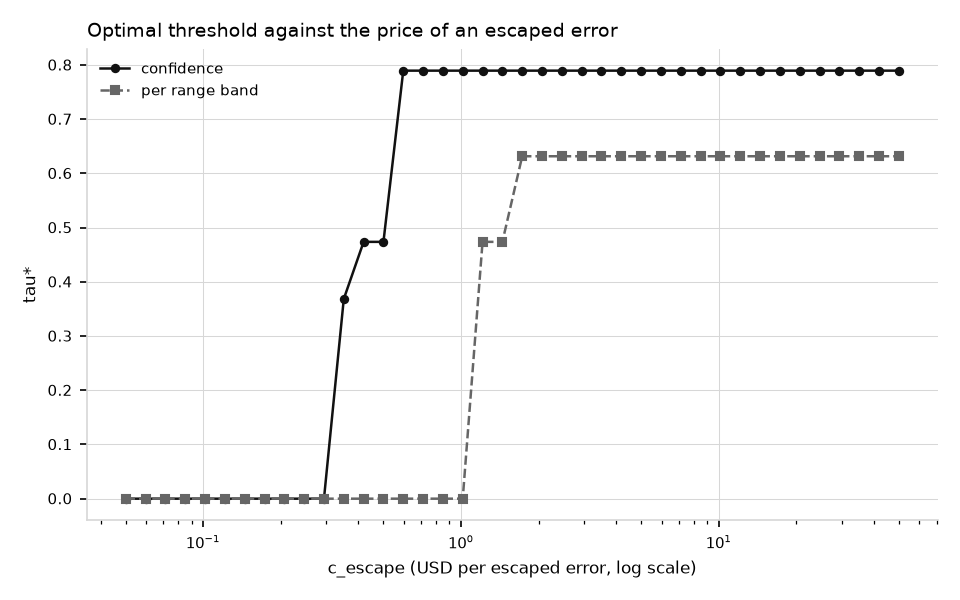
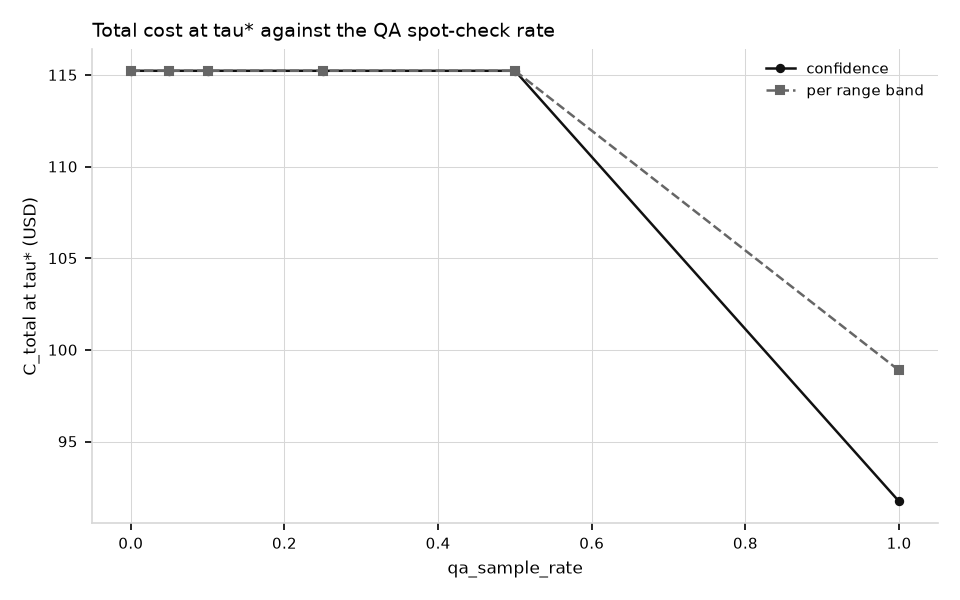
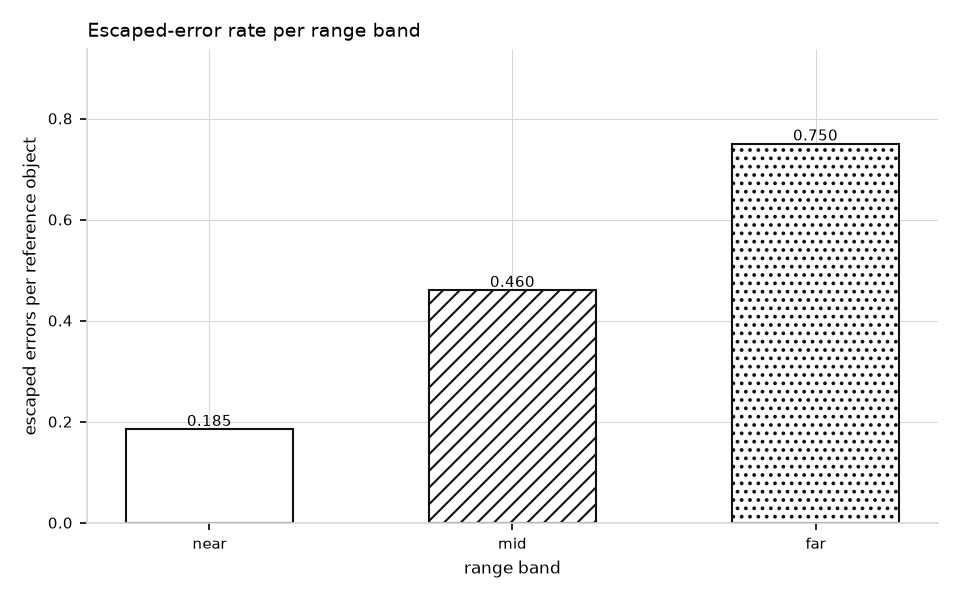
The disagreement-gated frontier is awaiting data: it needs the second geometry backend, which lands at v0.2.
Attribution
synthetic tier: attribution is a harness check, not a sensor claim
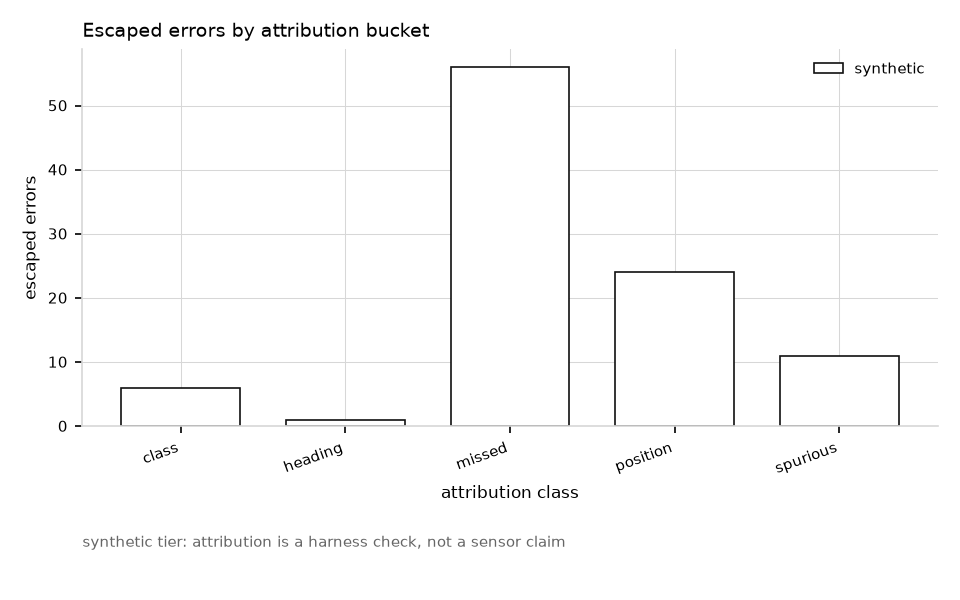
| Bucket | Class | Errors |
|---|---|---|
| synthetic | class | 6 |
| synthetic | heading | 1 |
| synthetic | missed | 56 |
| synthetic | position | 24 |
| synthetic | spurious | 11 |
Policy comparison
awaiting dataThe verdict needs two policies run over the same real frames, which is v0.2. The statistic and its failure condition were pre-registered before any real data was touched: mean USD saved per frame at equal frame auto-accept, failing if it is not positive or its interval includes zero.
Drift
awaiting dataThe p-chart runs on the per-scene cross-backend disagreement rate, which needs both backends. It lands at v0.2 with the cached tier.
Metrics, KPIs, evals
| Metric | Type | What it tells the PM |
|---|---|---|
| Auto-accept rate | fraction | How much of the work the machine keeps. Reported per frame, because a human can only recover a double miss by opening the frame. |
| Escaped error rate | errors / object | Errors per in-region reference object in frames nobody looked at. Includes the objects both labelers missed. This is the quality number that matters. |
| Total expected cost | USD | Compute, plus review time for routed cuboids and frames, plus QA spot-checks, plus a price on every escaped error. Labeling cost alone is minimised by accepting everything, which is why it is not the objective. |
| Threshold sensitivity | curve | The optimal threshold as a function of what a bad label costs downstream, swept over 0.05 to 50 USD. Nobody knows that cost, so the page ships the curve instead of asserting a number. |
| Error attribution | share per backend | Which sensor's job it was: camera class errors, frustum placement, LiDAR clustering, misses. Tells a team which part of the stack to fix first. |
| Policy comparison | USD / frame | Mean USD saved per frame at equal frame auto-accept rate, with a scene-clustered bootstrap interval over 1000 whole-frontier resamples. The verdict on the thesis. |
Success criteria
Cost model
| Parameter | Value |
|---|---|
rate_hr | 18.0000 |
t_review_s | 45.0000 |
t_frame_open_s | 20.0000 |
c_compute | 0.0008 |
c_escape | 5.0000 |
human_error_rate | 0.0300 |
qa_sample_rate | 0.1000 |
qa_multiplier | 1.0000 |
Review times and annotator rates are cited public figures, not measured sessions. The cost curves are illustrative, not a quote.
Appendix
| Key | Value |
|---|---|
tier | synthetic |
policy | confidence |
params | {"tau": 0.5} |
n_frames | 40 |
n_scenes | 4 |
overall | band all |
per_band | near, mid, far |
attribution | {"synthetic": {"class": 6, "heading": 1, "missed": 56, "position": 24, "spurious": 11}} |
escaped_error_count | 98 |
override_rate | awaiting data |
notes | awaiting data |
overall.band | all |
overall.n_frames | 40 |
overall.n_consensus | 296 |
overall.n_refs | 216 |
overall.auto_accept_rate_frames | 0.600 |
overall.auto_accept_rate_cuboids | 0.578 |
overall.escaped_error_rate | 0.454 |
overall.median_center_offset_m | 0.846 |
overall.heading_mae_deg | 0.543 |
overall.class_accuracy | 0.956 |